
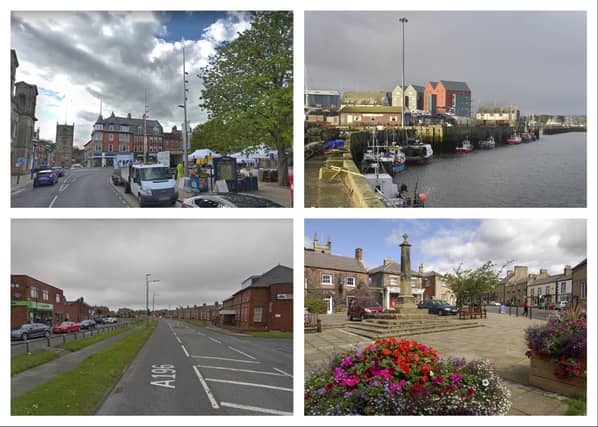

A new report ranks neighbourhoods in Northumberland based on how much house prices have increased over the past year.
Online Marketing Surgery and BLG Development Finance put together the House Price Change Report, which looks at how much median house prices went up in Northumberland between September 2023 and September 2024.
They used data from the Office for National Statistics to compare median house prices in different areas of Northamptonshire for those two dates. Then they worked out which areas had the biggest increases.
Some places saw property prices increase by as much as 27.1%.
Click through our gallery to see if your neighbourhood made the list, from number 10 up to number one.
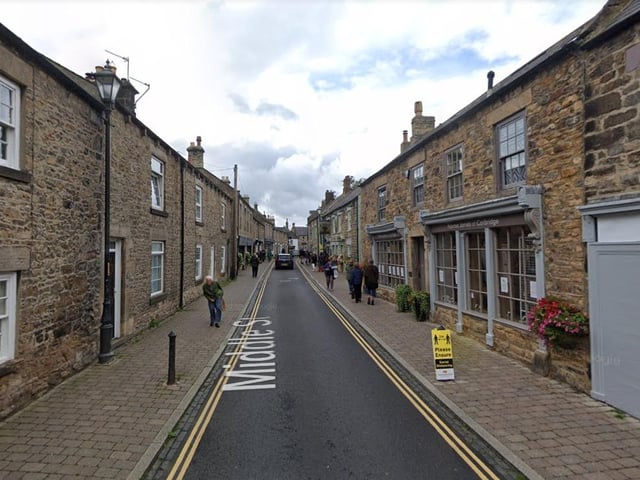
1. Stocksfield, Riding Mill and Corbridge
In 10th place is Stocksfield, Riding Mill and Corbridge where homes sold for an average of £385,000, up from £369,950 the previous year - a rise of 4.1%. Photo: Google
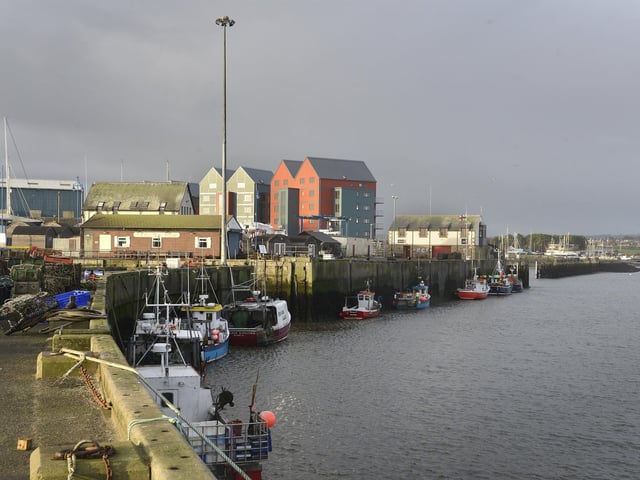
2. Amble, Shilbottle and Swarland
In 9th place is Amble, Shilbottle and Swarland where homes sold for an average of £230,000, up from £220,000 the previous year - a rise of 4.5%. Photo: Jane Coltman
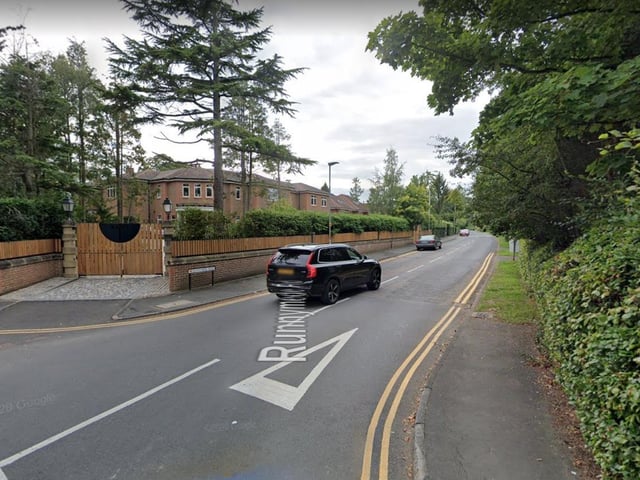
3. Darras Hall, Stamfordham and Heddon
In 8th spot, Darras Hall, Stamfordham and Heddon, homes sold for an average of £595,000, up from £556,162 - a rise of 7%. Photo: Google
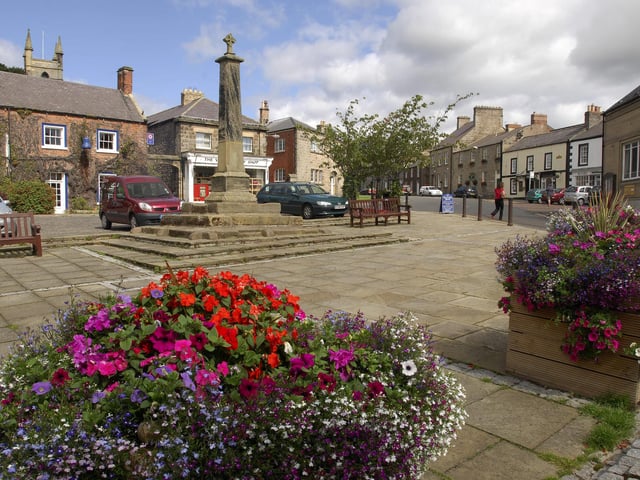
4. Seahouses, Belford and Wooler
In 7th place, Seahouses, Belford and Wooler property prices rose from £258,500 to £280,000 - an increase of 8.3%. Photo: Jane Coltman